Scopus · Web of Science · Biblioshiny-style indicators
Bring your export.
Get the bibliometric report.
No API key and no institutional login on our side. You export the records you are licensed to use, Phở reads them, and every number in the report is computed by code you can re-run in Google Colab.
How it works
-
01
Export from the database
Scopus: select your results, Export, CSV, and tick every information group (citation, bibliographical, abstract and keywords, funding, other). Web of Science: Export, Plain text file or Tab delimited file, Record content "Full Record and Cited References".
-
02
Upload to Phở
In a chat, attach one or more export files and ask for a bibliometric analysis. Phở recognises each file by its content, labels it Scopus or Web of Science, and merges records that appear in both by DOI.
-
03
Download and keep working
You get a Word report with Methods and Results, an Excel workbook, the figures, the merged records as CSV, and a notebook that opens in Google Colab and re-creates the same analysis.
What the report contains
- Main information: documents, timespan, annual growth rate, authors per document, international co-authorship
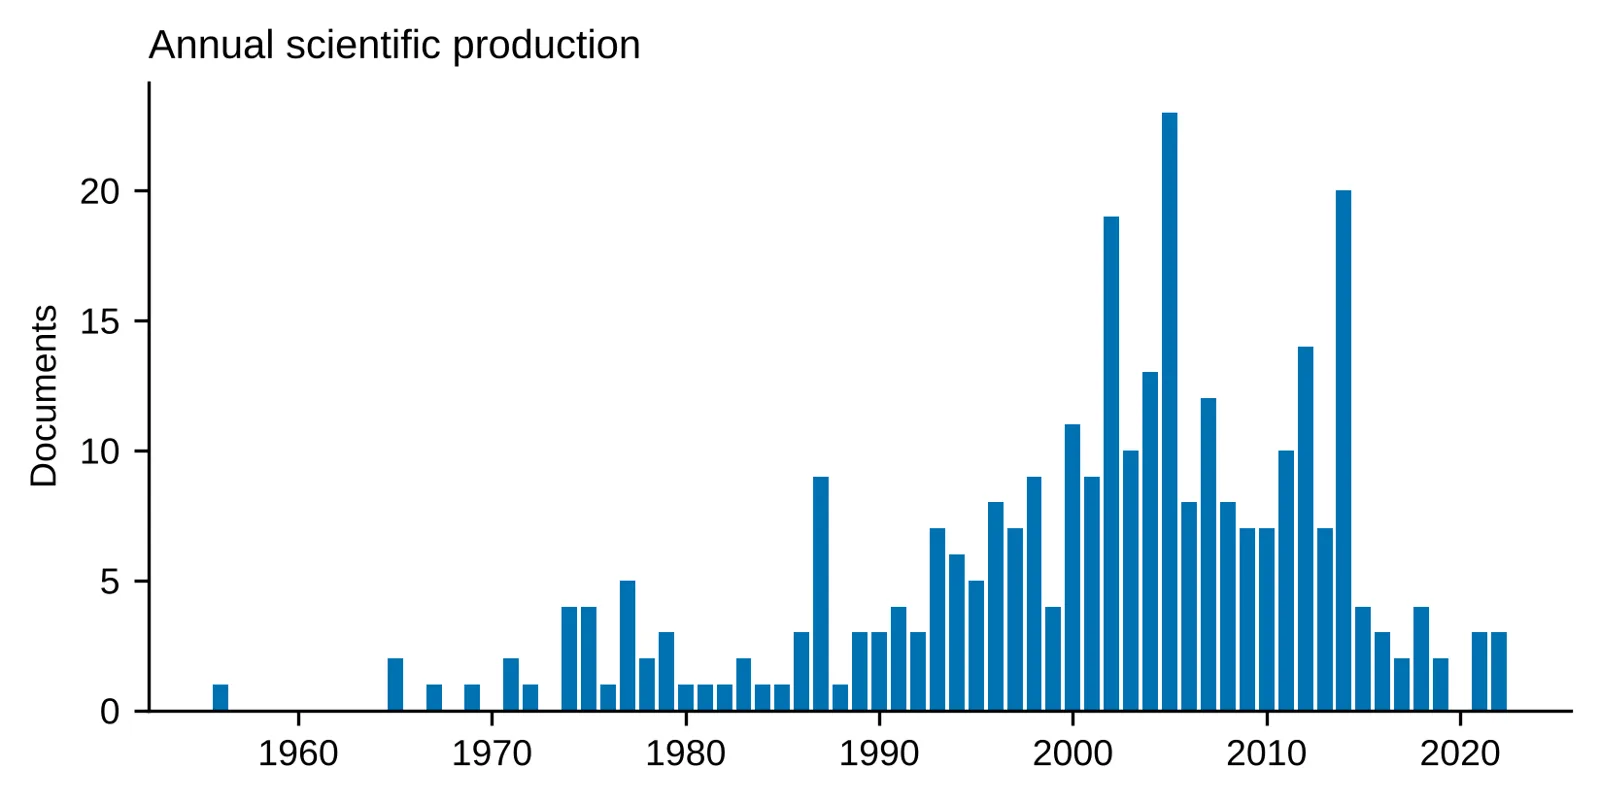
- Annual production and average citations per year
- Most relevant sources with h, g and m index, and Bradford zones
- Most relevant authors with h, g and m index, and Lotka’s law
- Countries with single-country and multiple-country publications (SCP / MCP)
- Most cited documents and trend topics
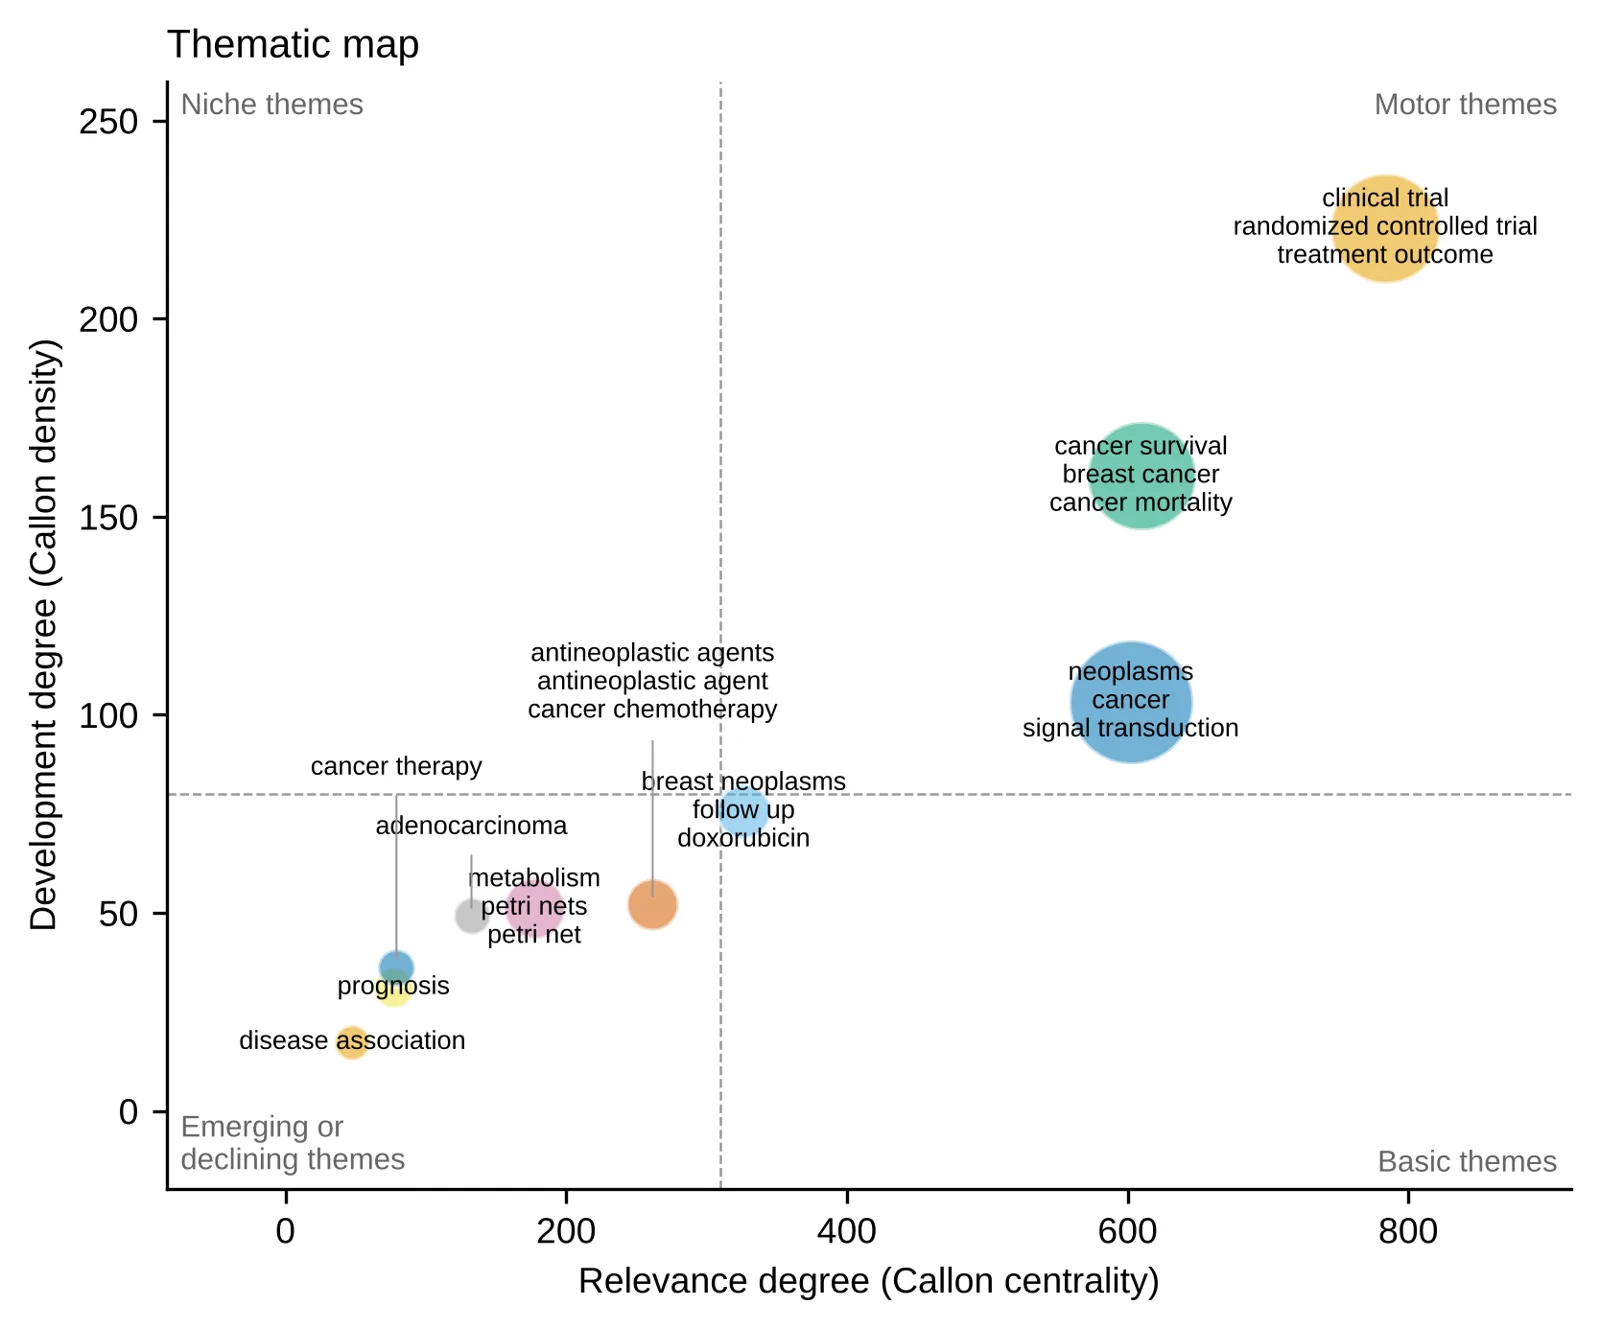
- Thematic map (Callon centrality and density) and a three-field plot
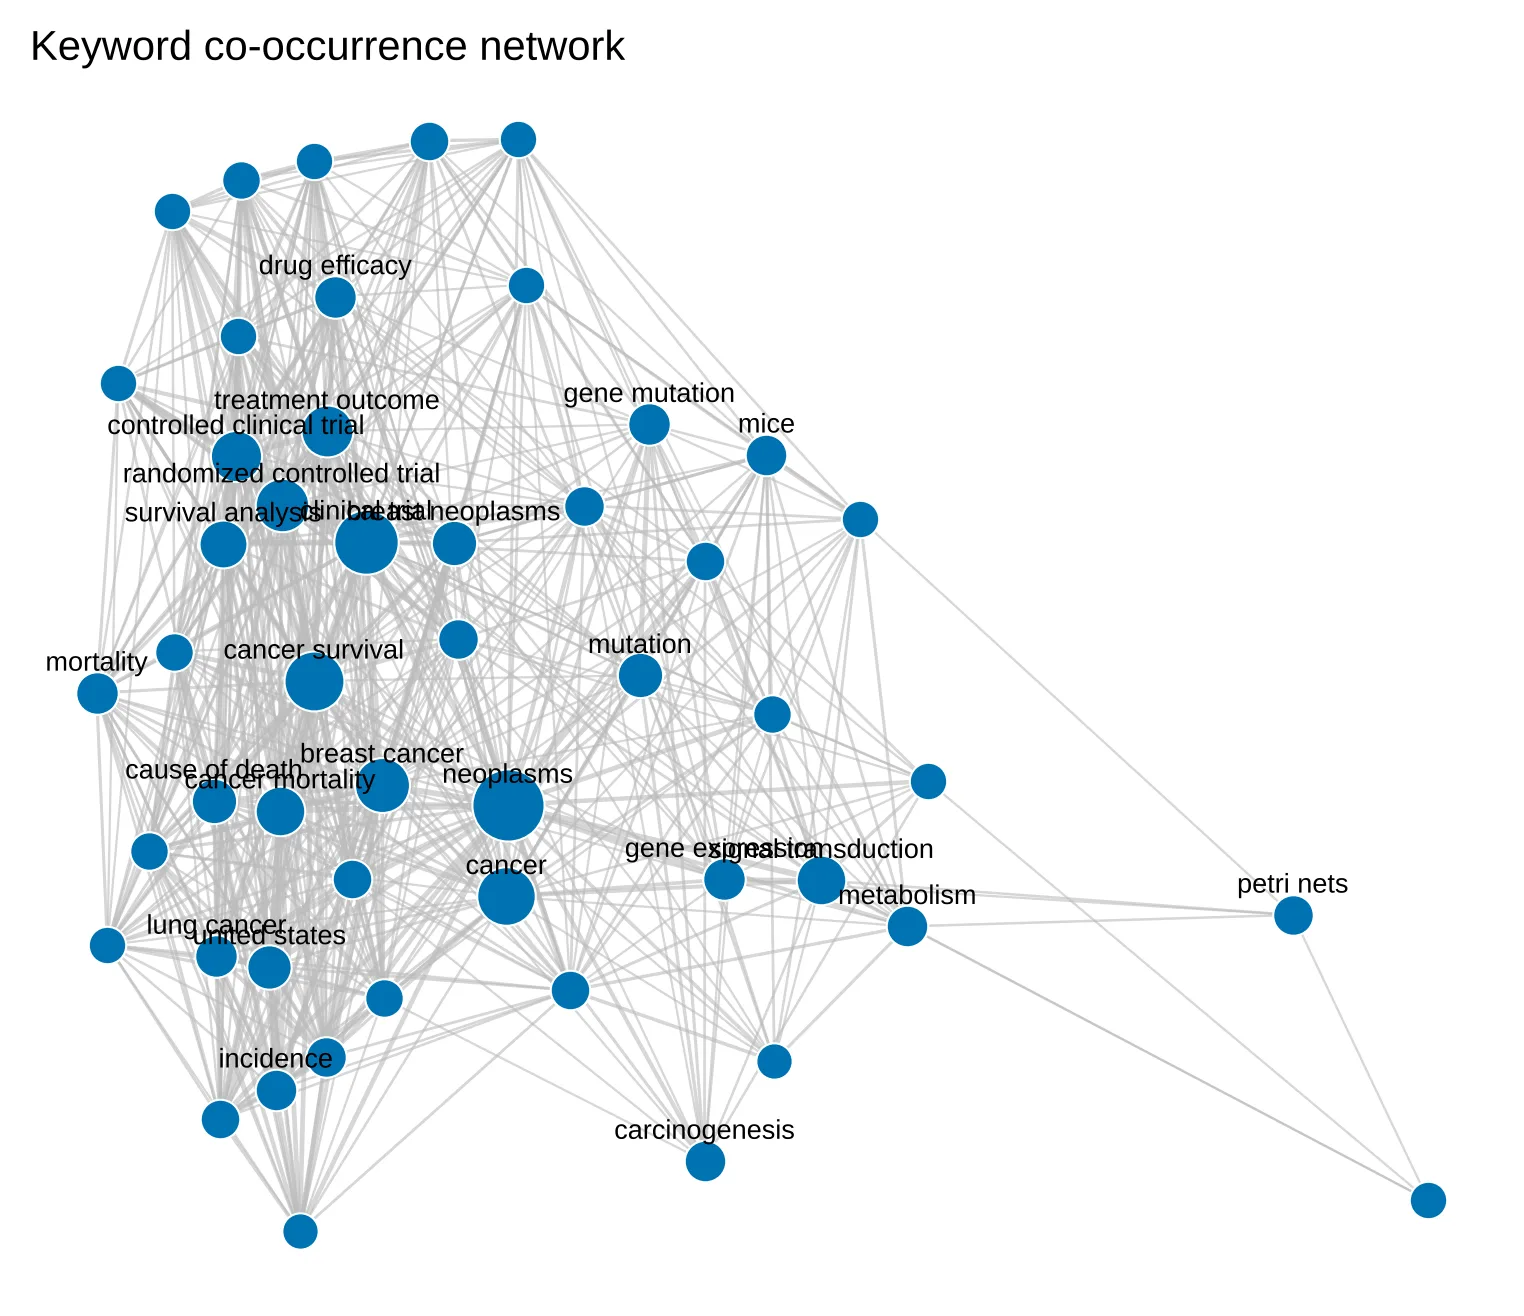
- Co-authorship, keyword co-occurrence and country collaboration networks
Indicator names follow bibliometrix / Biblioshiny so the tables read the way your team already knows them. The node and edge sheets in the workbook open directly in VOSviewer and Gephi.
Sample report
Built from three public test exports (two Scopus CSV files and one Web of Science file): 312 records read, 7 duplicates merged, 305 documents, 1956 to 2022.
- Word report bibliometric_report.docx · 2.8 MB
- Excel workbook (VOSviewer / Gephi sheets) bibliometric_tables.xlsx · 50 KB
- Colab notebook bibliometric_analysis.ipynb · 90 KB
Open the notebook in Colab
In Google Colab choose File, Upload notebook, and pick bibliometric_analysis.ipynb. Put your own file names in the FILES line of the upload cell, then run all cells; the notebook asks you to upload any file that is missing. The notebook writes the same module Phở used, so the counts match.
What Phở does not do
- It does not log in to Scopus or Web of Science, and it does not call their APIs. You stay inside your licence.
- Up to 500 records per file. Export larger result sets as several files.
- The report states what was counted and how. Phở writes the narrative around those numbers; it does not invent indicators the code did not compute.
Sample data: public test files from the litstudy (NLeSC) and metaknowledge (networks-lab) projects on GitHub. Scopus is a trademark of Elsevier; Web of Science is a trademark of Clarivate. Phở is not affiliated with either.